

Provider Supply Analytics
Child Care Provider Supply Analytics for State Agencies
Stay ahead of supply changes with the most comprehensive child care provider supply analytics available to state agencies. Track provider churn, monitor capacity trends, and understand availability patterns to maintain a stable, sufficient early childhood care network- all in one place.
Enriched Provider & Service Analytics
Comprehensive, configurable dashboards for understanding the dynamics of your state's provider network.
3Si continues to enhance the CUSP Foundation suite with new, enriched Provider and Services Analytics dashboards designed to help users understand and analyze the provider landscape with flexibility, depth, and clarity. Built as a true child care provider network analytics platform, CUSP gives state and local agencies the licensed child care provider data they need to make confident, timely decisions.

Configurable for Every State
Available in both Power BI and Tableau, dashboards adapt to your state's data and programmatic priorities- from family child care home analytics for state agency teams to broader child care business type analytics platform views.

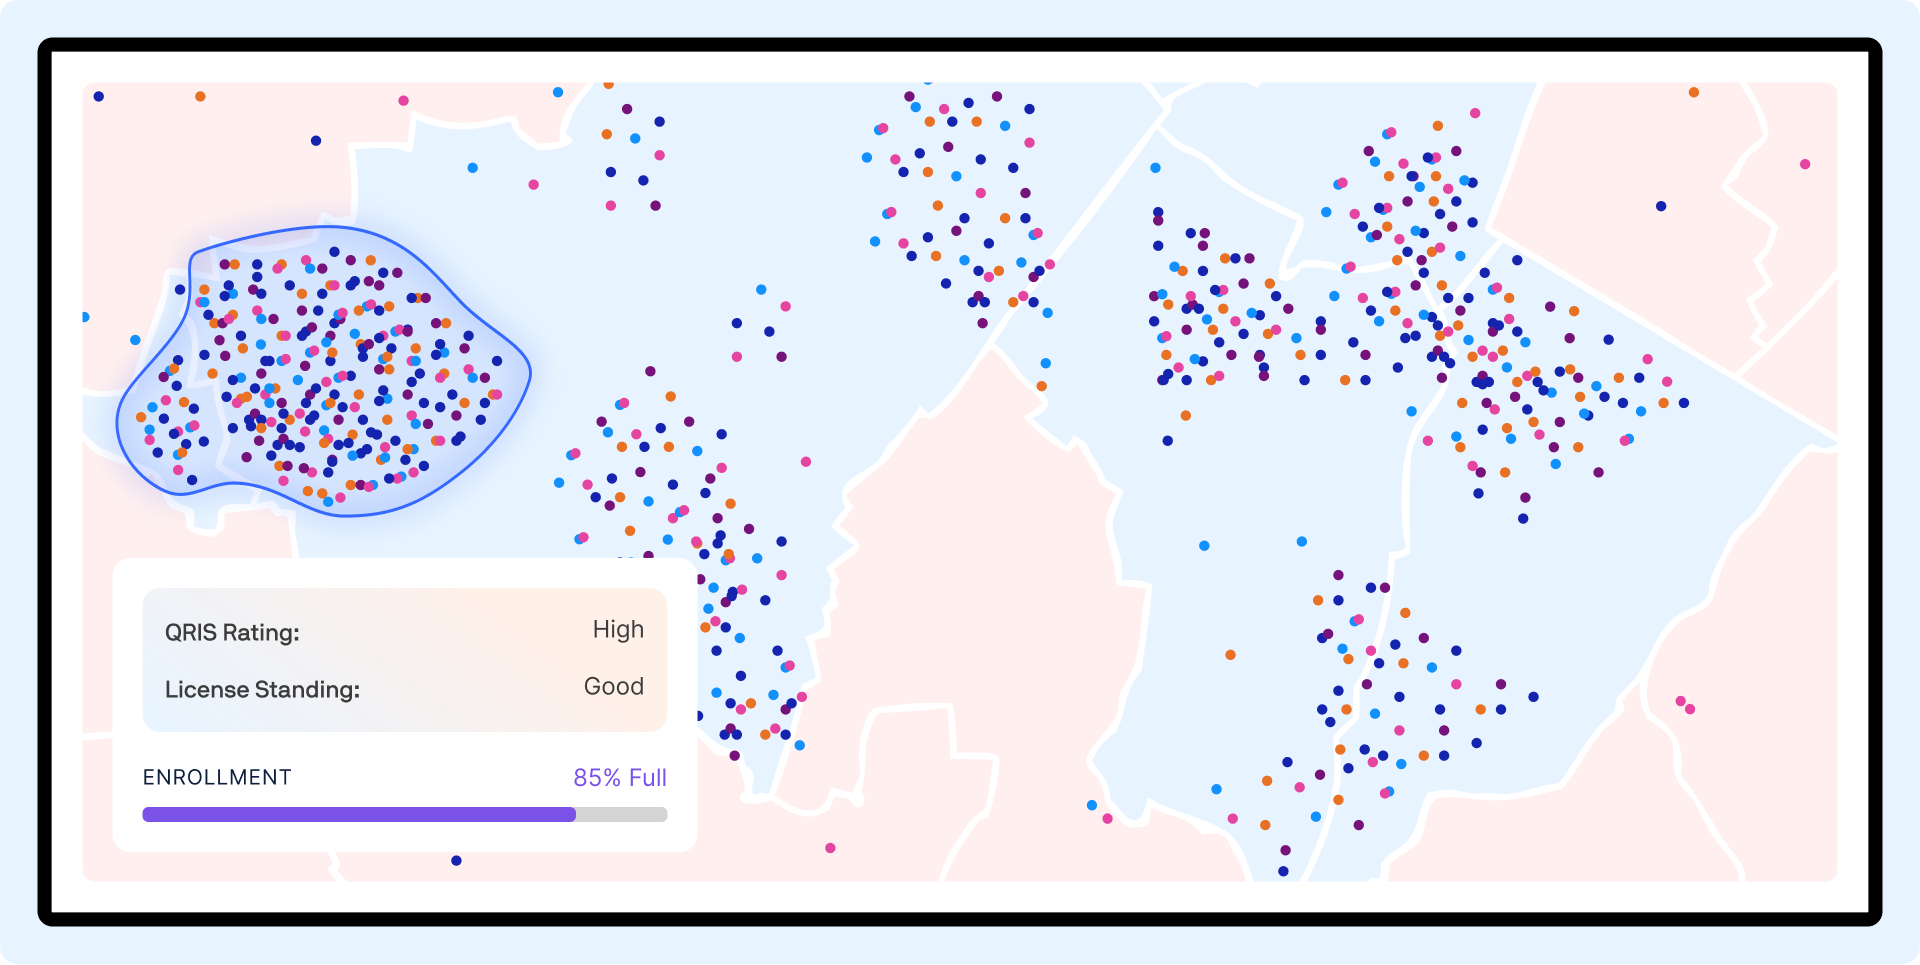
Dynamic Provider Mapping
Visualize child care provider geographic distribution, capacity, and licensing details across geographies and time. Understand child care supply distribution insights at the county, region, or ZIP code level.

Cross-Sectional & Longitudinal Views
Explore trends by month, year, or region to reveal system stability and growth patterns. Analyze child care supply and demand analytics side by side to reveal where gaps are widening or closing.

Integrated Data Refreshes
Linked directly to the CUSP backend and refreshed with every CUSP data release, this real-time child care supply pulse analytics engine ensures your team is never working with stale information.
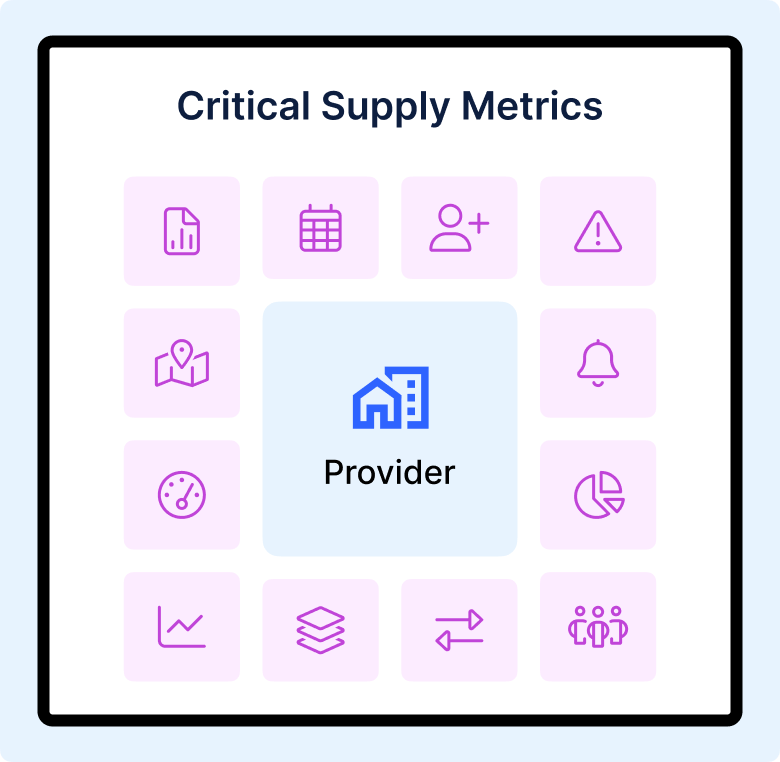
Critical Supply Metrics
Track the health and stability of your provider network.

Provider Churn Tracking
Monitor providers entering and exiting the market with our built-in child care provider churn analytics tool. Identify trends and take proactive action before capacity is lost.

Capacity Analysis
Our child care capacity analysis platform helps you understand total licensed capacity, utilization rates, and available slots across your network. Drill into child care provider capacity utilization metrics by region, provider type, or age group to identify where supply is tight and where it's underused

Growth & Decline Patterns
The child care provider growth index platform surfaces the geographic and programmatic trends that drive strategic planning. Understand cross-jurisdictional child care supply trends and identify which markets are gaining or losing ground.

Availability Trends
Track how availability changes over time and across external factors using child care provider availability trend analytics. Understand seasonal variation, waitlist pressure, and demand-supply imbalances to anticipate future gaps.

Provider Type Mix
Go beyond headcounts with a child care business type analytics platform view that reveals your network's composition by type, size, and characteristics. Compare family vs. center-based ratios and understand how provider mix affects access and stability.

Early Warning Indicators
Our child care early warning indicator analytics engine helps agencies stay ahead of disruptions. This child care sudden closure detection tool flags irregular patterns- ownership changes, enrollment drops, reporting anomalies- before they become crises.
Comprehensive Supply Intelligence
Multi-dimensional analysis for informed decision-making.


Stage 1: Entry
Licensing Compliance Teams
Monitor renewals and provider activity in real time. CUSP tracks new applications through to licensure, giving your team a complete view of pipeline capacity and child care provider geographic distribution of new entrants entering the market.
-
 Applications submitted
 -
Licenses issued by month
-
Time from application to opening
-
New capacity added to system
-
Geographic distribution of new providers
Stage 2: Active Operation
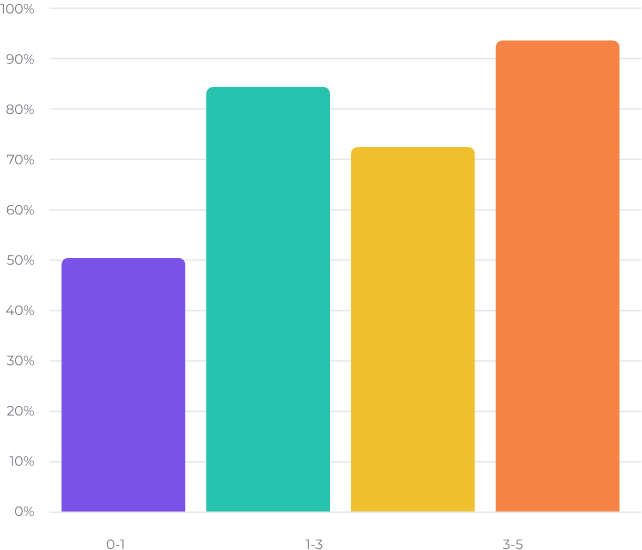
Capacity Utilization
Understand how efficiently capacity is being used with detailed child care provider enrollment position analytics. This stage of the child care supply intelligence dashboard (state-level) captures utilization patterns that reveal which providers are underserving their licensed capacity and which are consistently full.
-
Overall utilization percentage
-
Utilization by provider type
-
Utilization by age group
-
Underutilized vs. full providers
-
Seasonal utilization patterns

Stage 3: Performance Tracking
Time-Based Trends
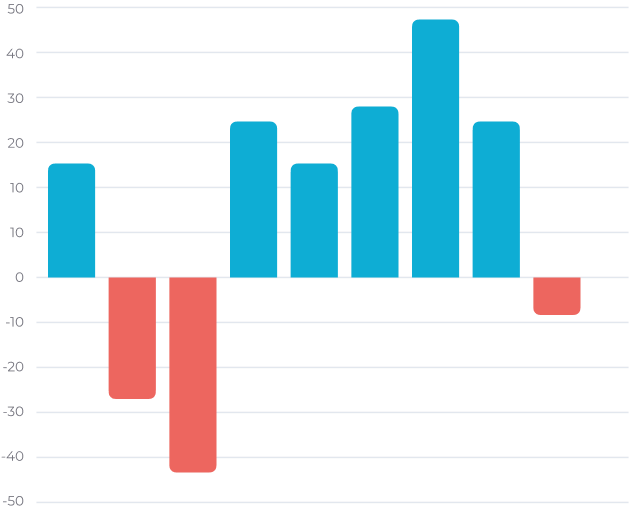
Analyze supply changes over various time periods using our predictive child care supply analytics and child care program stability analytics capabilities. Multi-year trend lines and leading indicator tracking allow agencies to model future supply needs and prepare proactively- including tracking child care supply elasticity analytics to understand how the network responds to policy and funding changes.
-
Month-over-month changes
-
Year-over-year comparisons
-
Multi-year trend lines
-
Seasonal adjustment factors
-
Leading indicator tracking
Stage 4: Exit
Provider Exits & Closures
Monitor and analyze provider departures. This stage of the platform functions as a dedicated child care sudden closure detection tool, distinguishing between voluntary closures, involuntary license revocations, and temporary suspensions to help agencies understand the true drivers of capacity loss.
-
Voluntary closures
-
Involuntary license revocations
-
Temporary vs. permanent closures
-
Capacity lost to system
-
Closure reasons and patterns
Deeper Segmentation, Sharper Insights
Filter and analyze providers across critical dimensions for targeted insights.
CUSP's Provider Supply Analytics gives state agencies the flexibility to view provider data based on meaningful, policy-relevant factors- making it the most capable child care provider segmentation analytics tool available for government use. Dashboards include filters for:
- Quality rating (QRIS or state system)
- Participation in subsidized programs (CCDF, Pre-K, HS/EHS)- track child care provider subsidy participation rate trends over time
- Non-traditional hours offered (evening, overnight, weekend)
- Age groups served- including infant/toddler populations where the infant toddler child care supply gap is most acute
 Geographic coverage and facility type
- Licensed vs unlicensed child care provider analytics- understand the full market, not just the regulated portion
- Child care provider income level analytics- assess provider financial health alongside supply stability
- Child care supply by demographics analytics- understand access disparities across populations and geographies
Understand your provider network from every angle: capacity, quality, access, and stability.
How Organizations Use This Tool
Real-world applications of Provider Supply Analytics.

Prevent Supply Shocks
Identify early warning signs of closures or instability to intervene before capacity is lost. State teams using our child care market health monitoring software report faster response times and fewer surprise closures affecting families.

Recruitment Strategy
Target recruitment efforts to high-churn or under-capacity areas to stabilize supply. With child care provider recruitment strategy analytics built into the platform, agencies can prioritize outreach based on where new providers are most needed- informed by real child care supply and demand analytics.

Market Health Monitoring
Assess overall network balance and system health to guide policy decisions. The child care provider health dashboard (government-facing) gives leadership a single, reliable view of network-wide stability, including the statewide provider network health score and child care market analysis tools.

Provider Support Programs
Design targeted support initiatives for providers at risk of exiting the market. Child care provider support analytics (state-level) help identify which providers show signs of financial or operational stress, enabling proactive intervention before they close.

Capacity Planning
Forecast future needs based on historical trends and current utilization patterns. As a dedicated child care capacity planning analytics tool, CUSP helps agencies model supply scenarios, assess child care infrastructure investment analytics priorities, and align capital spending with projected demand.

Stakeholder Reporting
Provide clear, data-backed reports on network stability for leadership and partners. As a full-featured child care stakeholder reporting platform, CUSP generates shareable dashboards and reports that communicate market health, child care provider revenue analytics (government), and system trends to funders, legislators, and program partners.
Why Supply Analytics Matter
The business case for tracking provider supply.
Across the country, child care supply shortages are straining families, providers, and state systems alike. Without reliable child care market analysis and real-time data, agencies are often reacting to crises rather than preventing them. CUSP's child care supply intelligence dashboard puts state agencies in a proactive position- with the data to act early, allocate wisely, and plan strategically.
-
Prevent unexpected capacity losses before they impact families
-
Support policy development with concrete child care supply by demographics analytics
-
Justify resource allocation for provider support programs using child care infrastructure investment analytics
-
Identify market instability early using child care early warning indicator analytics
-
Track the impact of initiatives designed to stabilize supply through child care program stability analytics
-
Understand seasonal and cyclical supply patterns through child care provider availability trend analytics
-
Communicate market health to stakeholders using the statewide provider network health score and child care supply elasticity analytics
The child care slot access analytics platform within CUSP also enables agencies to flag accessibility gaps- including child care provider incompatibility flag analytics that surface mismatches between provider offerings and family needs- and model the investments required to close them.
The Power of Provider Insights
CUSP's Provider Supply Analytics empowers state agencies to visualize and manage the evolving dynamics of their provider networks. By combining real-time child care supply pulse analytics, cross-jurisdictional child care supply trends, and predictive child care supply analytics in a single platform, CUSP gives agencies the full picture of supply and demand- enabling smarter policy decisions, targeted interventions, and sustainable capacity planning.
Combined with Access & Gap Analytics, it provides a complete view of licensed child care provider data across the state, closing the loop between what's available, what's needed, and where to invest next.

Real-time Capacity Monitoring

Predictive Churn Modeling

Geographic Supply Mapping

Data-Driven Policy Insights
Secure & FERPA-Compliant Platform: All CUSP products are hosted securely on 3Si's managed technology stack, built for FERPA compliance and data protection.