

Bundled Suite
Service Gaps Suite
Identify where children and families lack access to the child care they need.

Service Gaps Suite
The Service Gaps Suite helps agencies pinpoint where child care needs exceed available services. Using analytics that integrate child, provider, demographic, and community-level data, agencies can identify child care deserts, understand disparities in access to child care across populations, and prioritize investments where they will have the greatest impact.
The Service Gaps Suite is designed to answer critical questions about access: Which communities are underserved? Which populations face the greatest barriers to access? And, where should resources be directed to close gaps?

Identify Access Deserts
Map child care deserts and underserved communities at the census-tract level to understand where families lack sufficient options. Visualize precisely where child care access is poor, moderate, or good in every community in your city or state.

Population and Community Analysis
Understand how race, language, income, and community conditions affect access to child care and identify populations facing the greatest barriers. See not just where gaps exist, but why.

Evidence-based Decisions
Make data-driven investments to close gaps and improve access. With targeted equitable child care investment analytics, present credible, evidence-backed plans to funders, legislators, and community stakeholders.
Included in the Service Gaps Suite
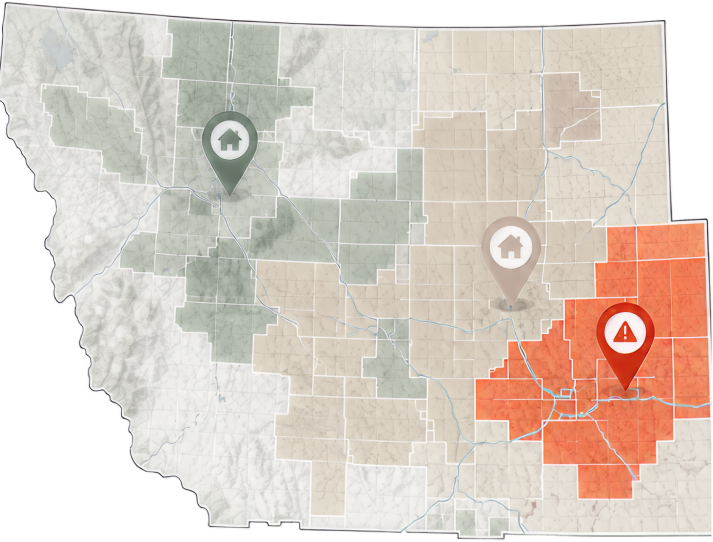

Rapid Churn & Instability

Rural Isolation & Economic Vulnerability

Severe Infant & Toddler Care Shortage
Access Desert Analytics
Identify communities where child care availability falls short of family need. Locate child care deserts using, the most accurate access desert analytics available.
-
 Census tract-level desert mapping, – Locate child care access gaps with much greater precision than ZIP code-level analysis, to direct investments to the specific neighborhoods where shortages are most acute.
 -
Rural access analysis, – Reveal the unique barriers facing rural families—including long travel distances and limited provider choice—to better target strategies and resources to improve access for rural communities.
-
Age-specific shortage identification – Uncover shortages in infant and toddler child care to direct funding, capacity-building, and policy interventions where the need is greatest.
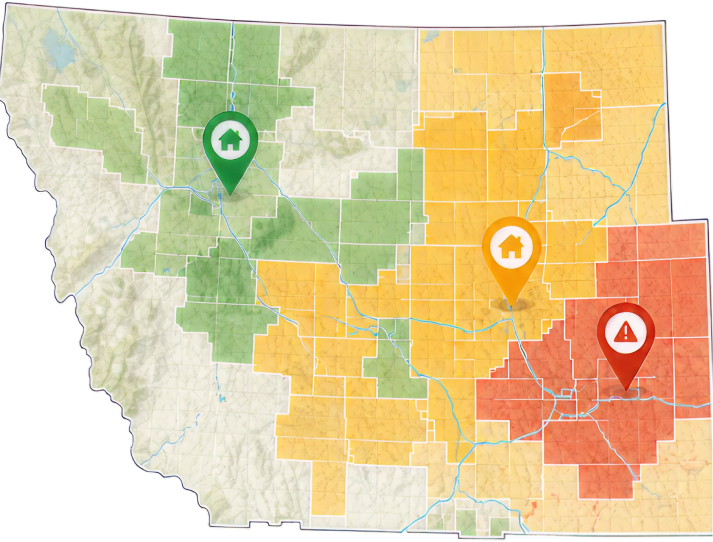
Ask the right questions
Investigate solutions to gaps with data to analyze space optimization versus new construction.
Child Care Gap Analytics
Understand who faces the greatest barriers to accessing child care and why. Analyze disparities across demographic, linguistic, and economic groups to uncover systemic barriers and inform targeted investments that expand access to quality early learning opportunities.
-
Demographic disparity analysis – Examine disparities across race, ethnicity, and household characteristics to identify underserved populations and focus resources where they are needed most.
-
Language access insights – Flag where language barriers may limit families’ ability to find and secure child care to enable more effective multi-lingual outreach, navigation support, and provider engagement.
-
Income-based access comparison – Compare child care access across income levels to understand where affordability challenges are greatest, to inform subsidy strategies.
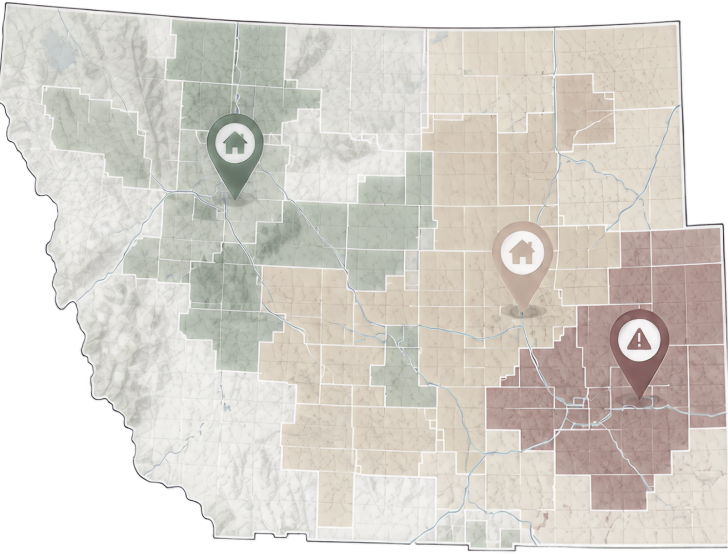
Explore communities by COI and SVI
Investigate by any geographic entity (Zip Code, Census Tract, County, etc.)
Community Analytics
Understand how neighborhood conditions influence child care access and demand. By analyzing child care data overlaid with community indicators such as the Child Opportunity Index (COI) [insert link] and Social Vulnerability Index (SVI) [insert link], agencies can identify where broader social and economic factors create barriers for families and prioritize investments where they can have the greatest impact.
-
Child Opportunity Index 3.0 integration – Identify communities with lower levels of opportunity for children and families, enabling priority-tier analysis to target child care investments, program expansion, and support services to areas with the greatest need.
-
Social Vulnerability Index integration – Pinpoint communities where factors such as economic hardship, housing instability, and transportation challenges may limit access to child care, to prioritize resources and design more responsive solutions.
-
Integrated community analysis – Combine multiple community indicators to support data-driven planning and investment decisions.
Part of the CUSP Foundation Ecosystem
The Service Gaps Suite and Service Supply Suite work together to provide a complete picture of the child care network.
-
 The Service Gaps Suite identifies where children and families need greater access to care.
 -
The Service Supply Suite evaluates whether the provider network has the capacity and stability to meet that need.
Built on the CUSP Foundation's integrated data model, both solutions give agencies a shared source of truth for planning, investment, and policy decisions.
CUSP Foundation
Core Modules
-
 Integrated data model
 -
Research Starter Kit
-
Analytics Library
-
Atlas
Bundled Modules
-
Service Gaps Suite
-
Access Desert Analytics
-
Child Care Gap Analytics
-
Community Analytics
-
-
Service Supply Suite
-
Provider Analytics
-
Child Care Fact Sheet (Community-level and Site-level)
-
Service/Program Integration
-
Real-World Impact
See how agencies across the country use the Service Gaps Suite to drive equitable, evidence-based decisions.
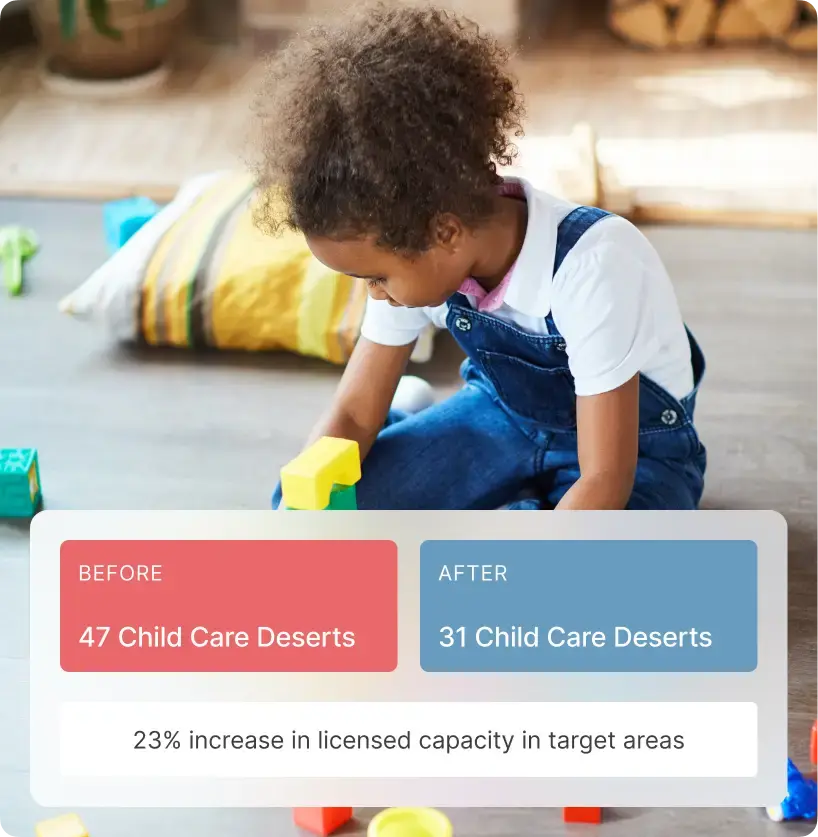
Targeting Investments in Underserved Communities
A state agency used the Service Gaps Suite to identify child care deserts, determine exactly where licensed slots were missing and why, and build a data-driven case for directing funds to areas with the greatest need. The analysis helped agency leaders prioritize grant funding for new facility development in communities that needed it most, resulting in a 23% increase in licensed capacity in previously underserved areas.
Using CUSP’s ongoing monitoring capabilities, the agency was also able to track progress and demonstrate return on investment to legislators and other stakeholders. The result is a targeted and accountable approach to expanding child care access where it was needed most.