A Connected Data Foundation for Early Childhood Systems
Early childhood data often lives in fragmented systems, making it difficult to understand which children are being served, where services are available, and other critical information needed to help children and their families. CUSP Foundation integrates information about children, families, providers, and programs into a single source of truth.
CUSP Foundation helps users:
-
Understand child care supply, demand, and service utilization
-
Identify unmet needs and gaps in access to child care
-
Monitor provider capacity and workforce trends
-
Analyze outcomes across programs and populations
-
Make faster, more informed policy and investment decisions that improve outcomes for children and families
-
Track progress and demonstrate return on investment to policymakers, funders, and other stakeholders
What Is CUSP Foundation?
CUSP Foundation is the connected data layer that links child, family, provider, and program
information into one system. It delivers the supply, demand, access, and service insights states need
to understand their landscape, strengthen programs, and support families more effectively.
What make CUSP Foundation different?
A whole population approach
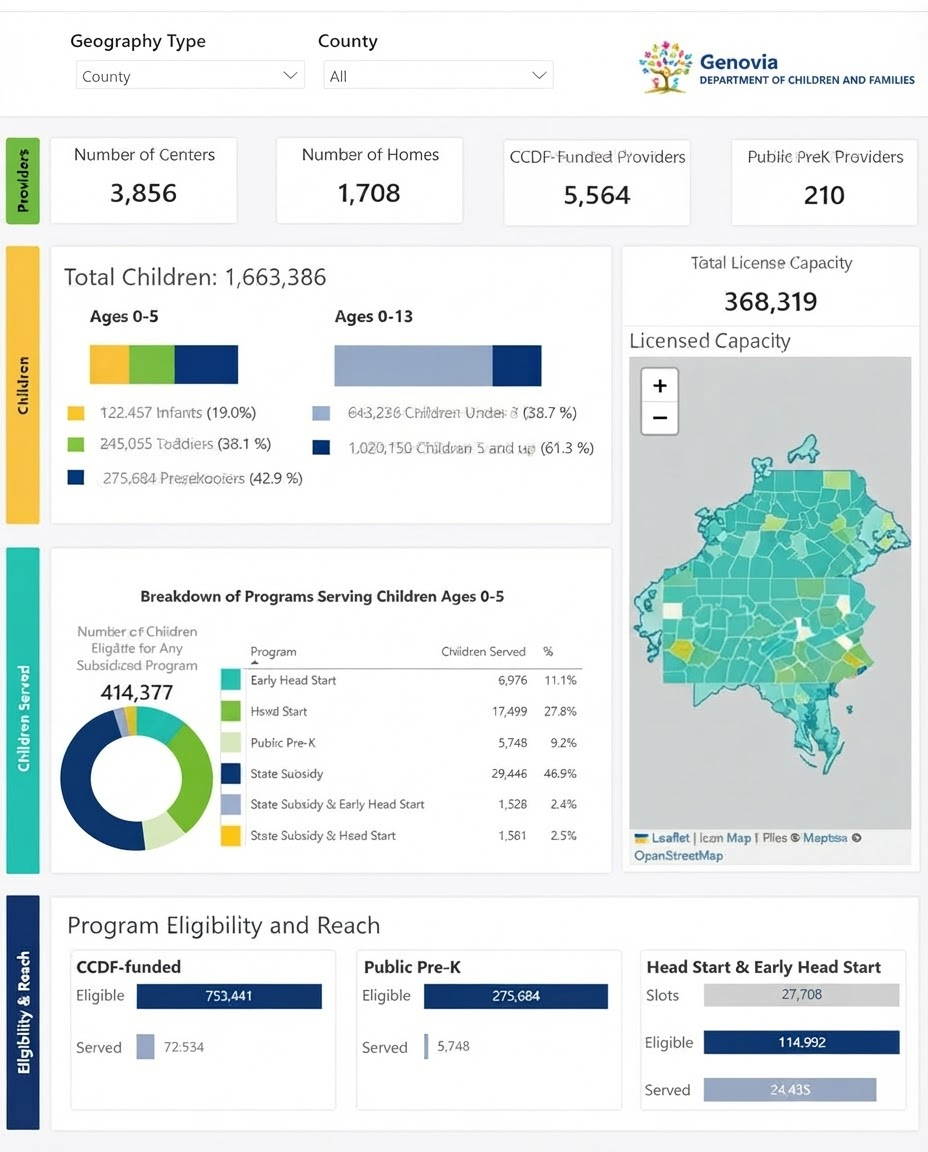
Traditional early childhood software provide a limited view of children already enrolled in individual programs, making it difficult to understand participation and needs across the broader early childhood system. CUSP Foundation models the entire child population, helping agencies understand who is being served, who is not, and where gaps in access remain.
CUSP Standard Modules
Standard Modules provide the primary tools agencies need to integrate data and start supporting coordinated, data-informed decision-making.
Core is 3Si's proprietary integrated data model and the technology that sets CUSP apart from other Early Childhood Integrated Data Systems (ECIDS). It transforms data from multiple agencies and programs into a single, governed foundation, creating a consistent, trusted view of the entire early childhood system.
Catalyst is the primary workspace for exploring, organizing, and sharing CUSP analytics, dashboards, reports, and data resources. With Catalyst, you can easily find the tools you need, without the time and effort it takes to build them from scratch.
Catalyst also helps agencies get more value from their data by enabling agencies to share findings, learn from peers, and benchmark progress.
The CUSP Starter Kit delivers immediate value with pre-configured charts, maps, and reports that can be deployed rapidly with minimal setup. The Starter Kit’s interactive tools and filters make it easy and intuitive to move from high-level insights to detailed analysis. Designed for analysts and program administrators, the Starter Kit module helps clients quickly gain a clearer picture of the where their system stands today and where gaps are growing.
Extend Your Insights: Population, Supply, and Gap Analytics
CUSP Foundation also includes modules that transform integrated data into targeted insights for planning, service design, and access analysis — covering the child population your state serves, the supply needed to serve them, and the gaps between the two.
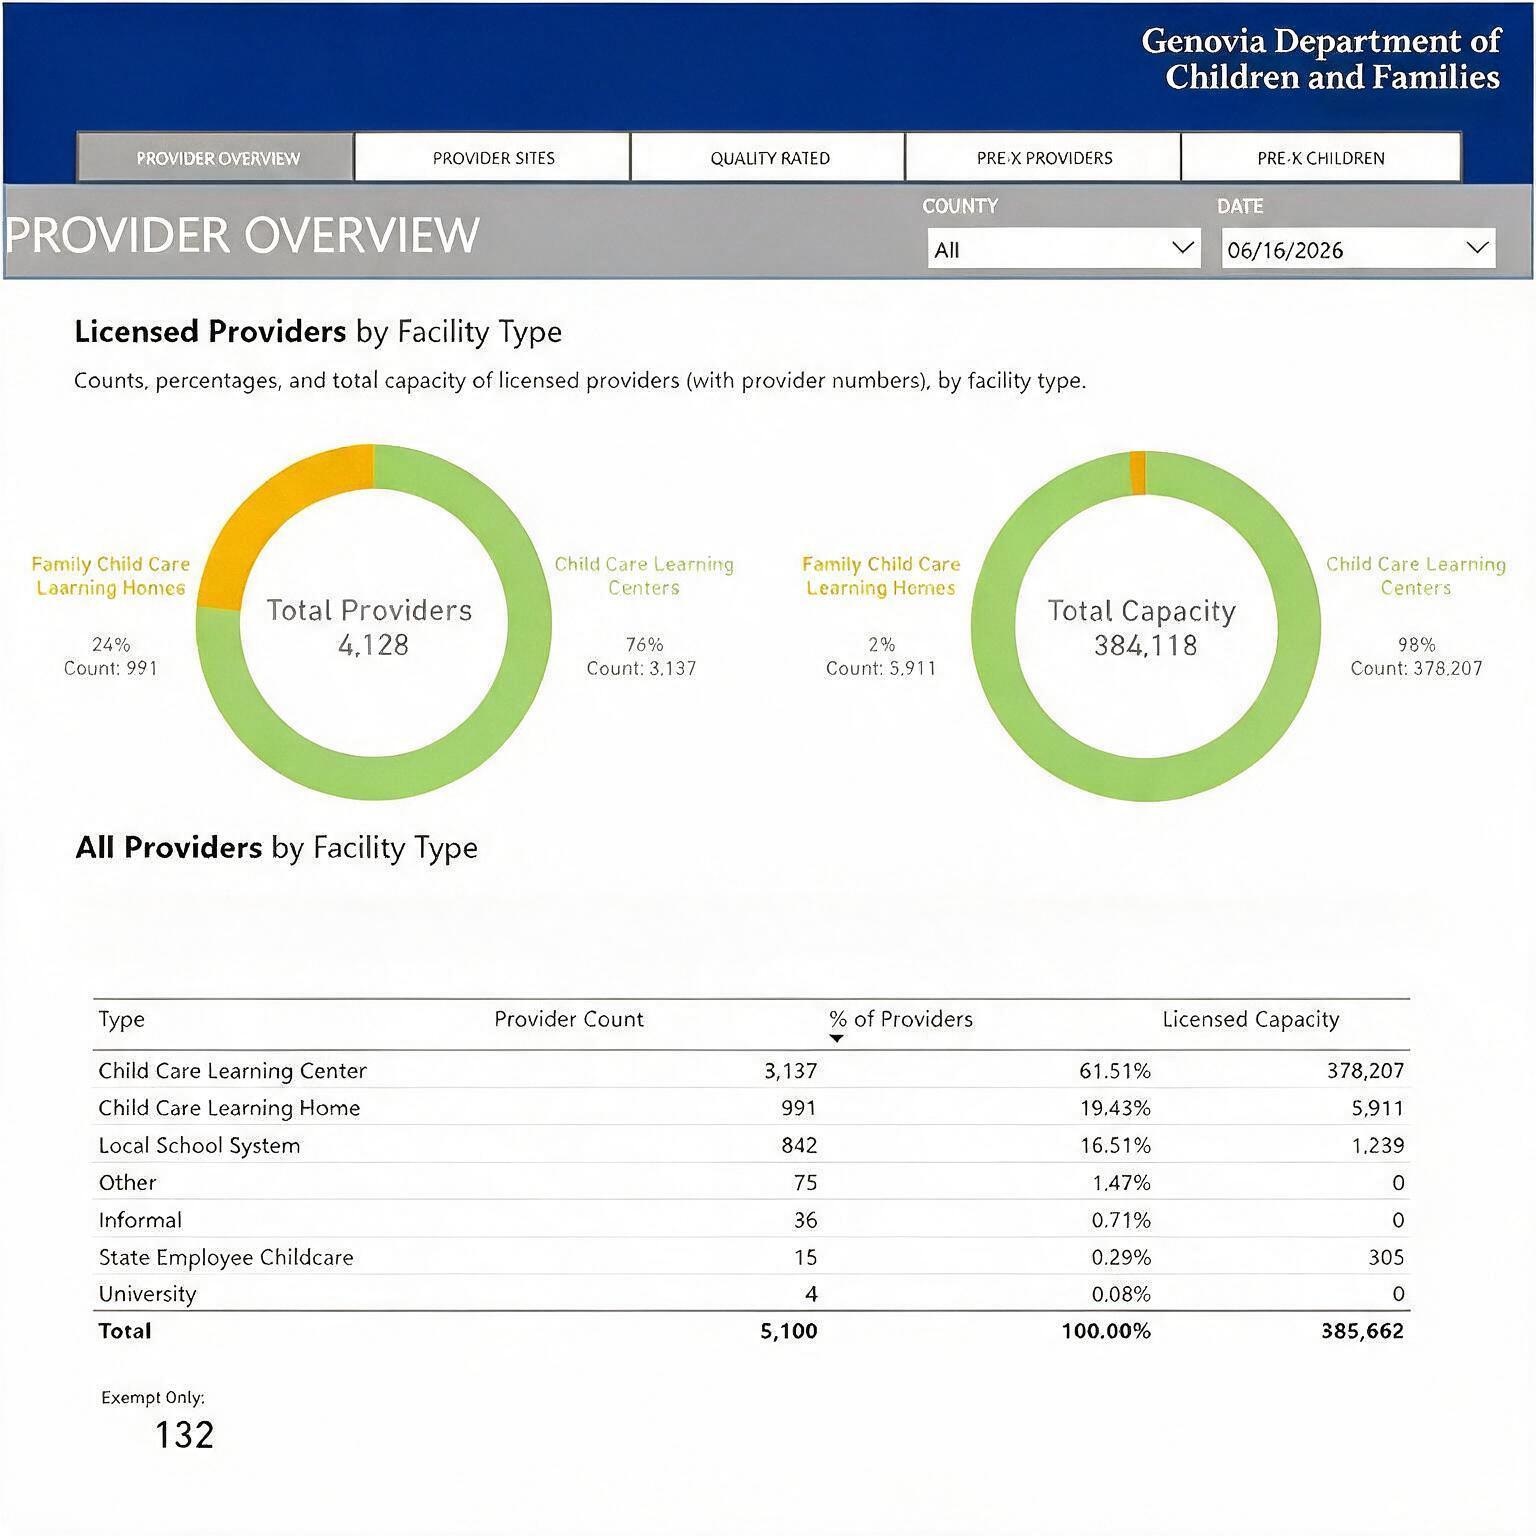
Provider Analytics helps agencies understand the availability, stability, and distribution of child care services across their city or state. By analyzing integrated data on licensing, workforce, subsidies, and other information, agencies can identify emerging supply challenges, anticipate future needs, and target resources where they will have the greatest impact.
Gap Analytics helps agencies understand where children and families face the greatest barriers to accessing child care. By combining service, population, and community data, the Gap Analytics enables agencies to identify unmet needs, understand the factors contributing to access challenges, and prioritize investments where they will make the greatest difference.
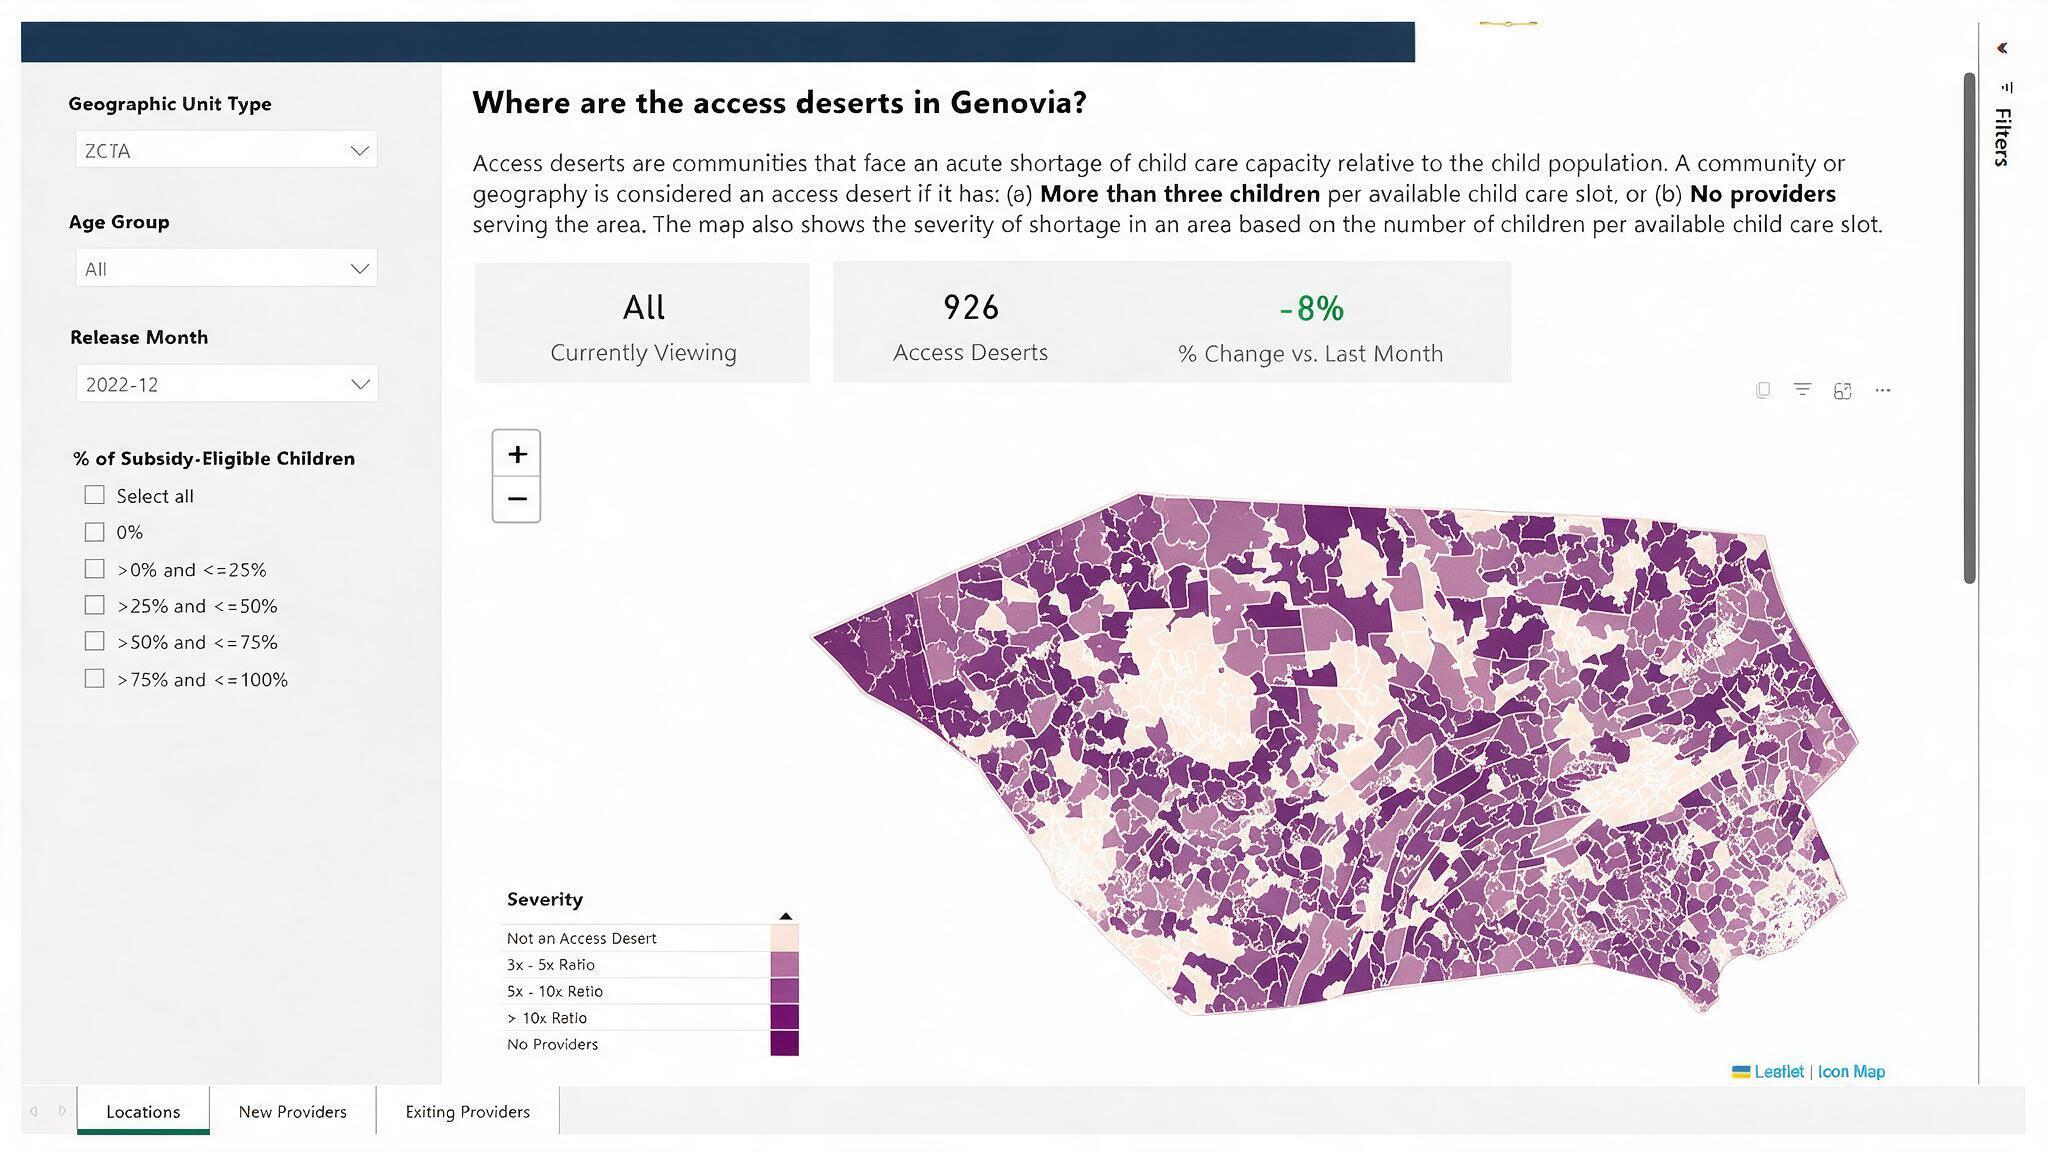
Access Desert Analytics helps agencies identify communities where families have limited or no realistic access to child care services. Built on Core, Access Desert Analytics moves beyond simple desert-or-not classifications to measure shortage severity across a continuum. Agencies can analyze gaps by age group and geography to understand where shortages are most severe and which children and families are most affected. Access Desert Analytics provides a geographically precise view of where child care supply falls short of community need, complementing Gap Analytics' ability to reveal patterns of unmet need across populations.
The Child Care Fact Sheet transforms complex data into clear, compelling one-page reports that help policymakers, funders, community leaders, and advocates understand needs and take action. Use the Child Care Fact Sheet to communicate supply needs and trends to policymakers, funders, and community members.
Extend Your Insights: Population, Supply, and Gap Analytics
CUSP Foundation also includes modules that transform integrated data into targeted insights for planning, service design, and access analysis — covering the child population your state serves, the supply needed to serve them, and the gaps between the two.
Provider Analytics
Provider Analytics helps agencies understand the availability, stability, and distribution of child care services across their city or state. By analyzing integrated data on licensing, workforce, subsidies, and other information, agencies can identify emerging supply challenges, anticipate future needs, and target resources where they will have the greatest impact.
With Provider Analytics, agencies can:
-
Monitor provider openings, closures, and workforce trends to detect potential supply disruptions before they become critical
-
Assess provider stability and capacity utilization to support retention and expansion strategies
-
Compare supply patterns across regions to prioritize investments and target resources to where the need is greatest
Access Desert Analytics
Access Desert Analytics helps agencies identify communities where families have limited or no realistic access to child care services. Built on Core, Access Desert Analytics moves beyond simple desert-or-not classifications to measure shortage severity across a continuum. Agencies can analyze gaps by age group and geography to understand where shortages are most severe and which children and families are most affected.
With Access Desert Analytics, agencies can:
-
Identify child care access deserts and measure the severity of local shortages at multiple geographic levels—from ZIP codes and municipalities to counties, school districts, and legislative districts
-
Track how access deserts change over time as providers enter, exit, expand, or reduce capacity—and see the direct impact of provider churn on community access status Overlay community-level context measures — including indices of social vulnerability, child opportunity, and socio-economic need — to identify where capacity shortages compound with broader structural constraints.
-
Overlay community-level context measures — including indices of social vulnerability, child opportunity, and socio-economic need — to identify where capacity shortages compound with broader structural constraints.
-
Support capacity planning and place-based investments with consistent, data-driven measures of access and unmet need.
Access Desert Analytics provides a geographically precise view of where child care supply falls short of community need, complementing Gap Analytics' ability to reveal patterns of unmet need across populations.
Gap Analytics
Gap Analytics helps agencies understand where children and families face the greatest barriers to accessing child care. By combining service, population, and community data, the Gap Analytics enables agencies to identify unmet needs, understand the factors contributing to access challenges, and prioritize investments where they will make the greatest difference.
With Gap Analytics, agencies can:
-
Identify communities where child care availability falls short of family needs
-
Assess and compare access to child care across regions to understand where opportunities are strong and where barriers to child care access persist
-
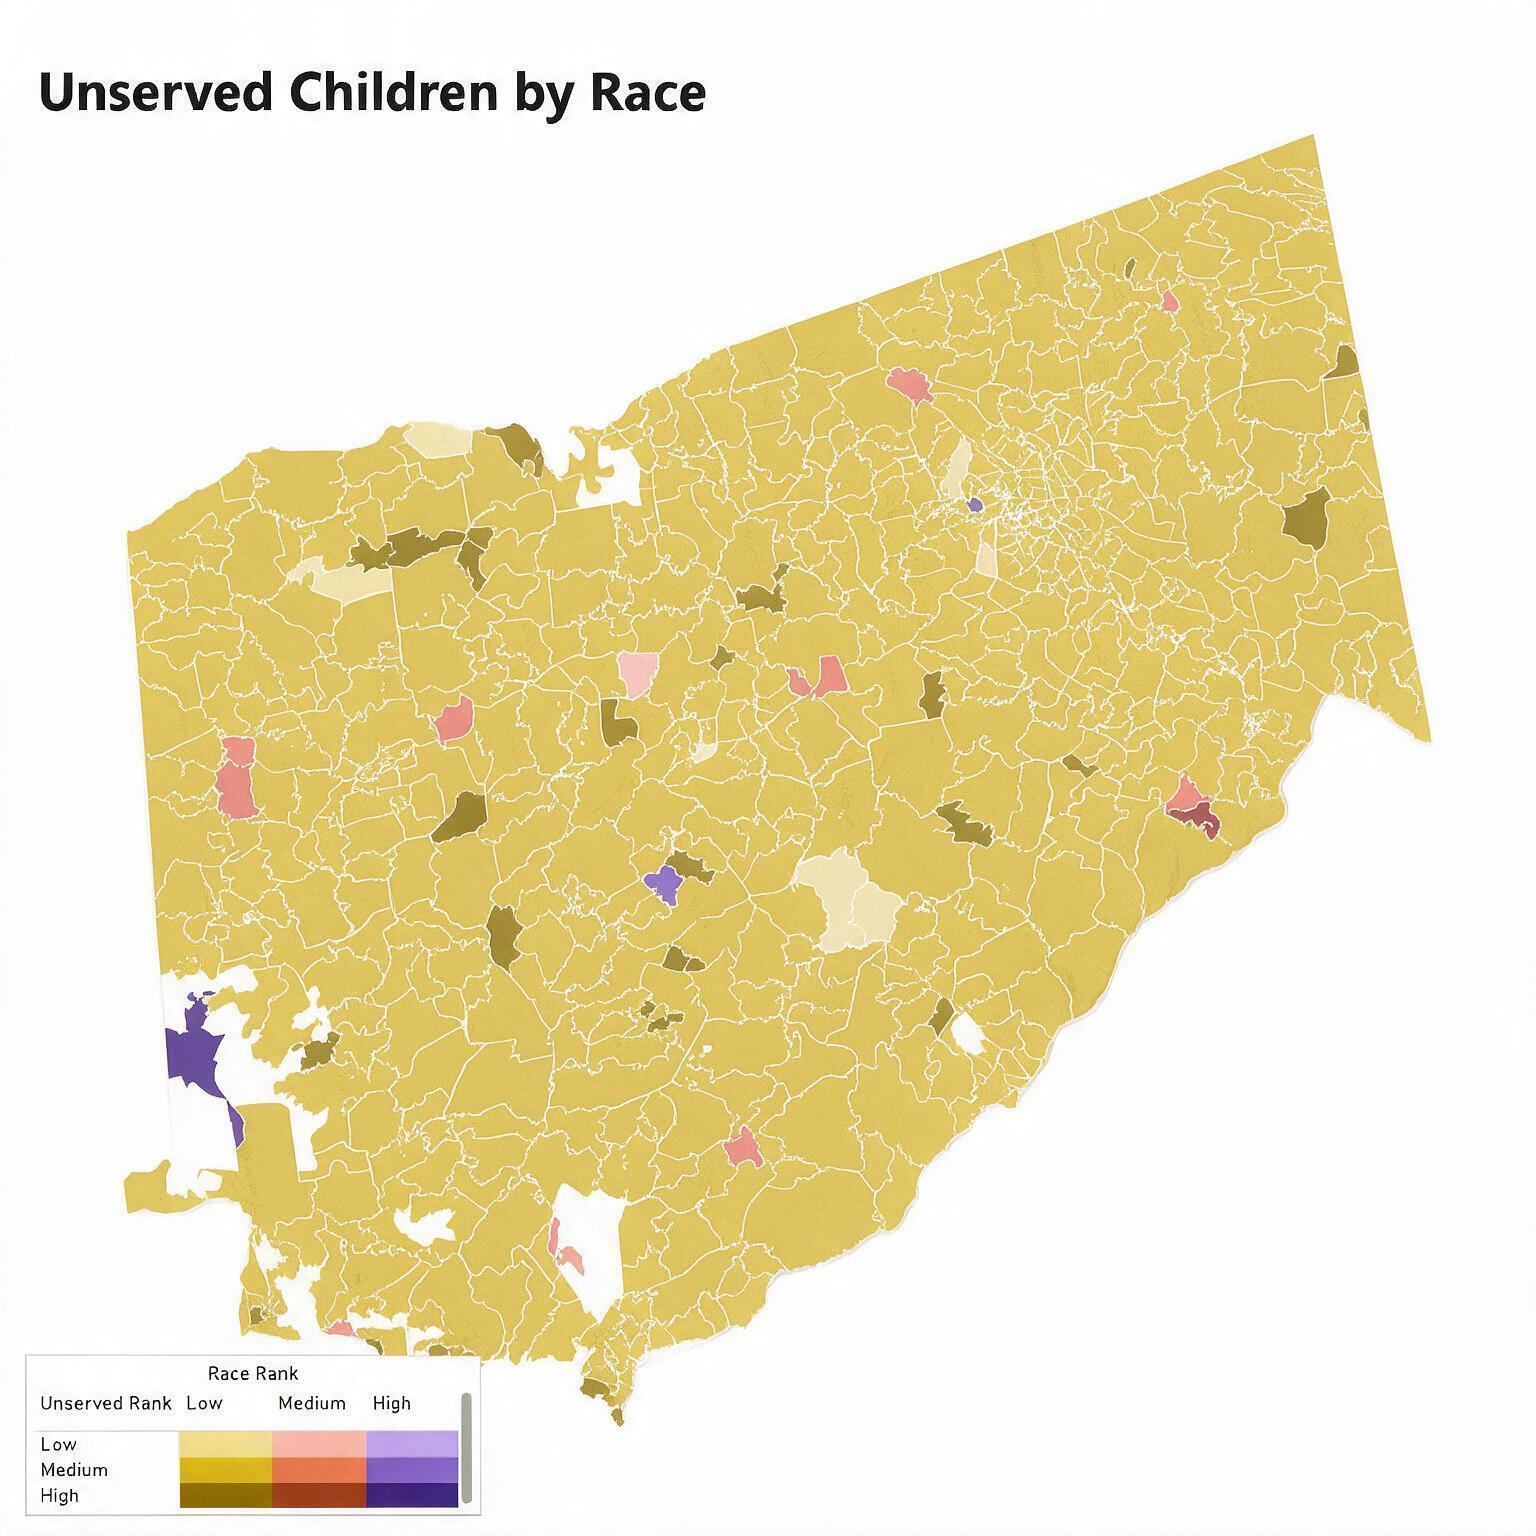
Analyze disparities in access across race, income, geography, and other demographic characteristics to identify underserved populations
-
Understand how transportation, distance, and other practical barriers affect families' ability to find and use child care
-
Evaluate how social and economic conditions influence child care access and family outcomes
-
Prioritize funding, program expansion, and policy interventions in areas with the greatest unmet need
Child Care Fact Sheet
Looking for operational tools?
CUSP Foundation provides the integrated data and analytics capabilities agencies need to understand their early childhood systems and act with confidence. If you are looking for tools that help program staff do their daily work across functions like child care subsidies, licensing, risk management, financial auditing, and regulatory compliance, explore CUSP Advanced. Available as an add-on to Foundation or as standalone modules, CUSP Advanced supports proactive and efficient program management.
Ready to get more from your state's data?
Get started with a connected data strategy that unifies child, family, and provider insights, and gives your agency the tools to close gaps, reduce inequity, and serve every child in your state.
Frequently Asked Questions
Together, these two modules give state agencies a complete picture of where child care needs are going unmet and why. Access Desert Analytics maps where child care supply is insufficient relative to community need, surfacing geographic patterns that can inform how transportation and other access barriers are shaping the picture. Child Care Gap Analytics examines both capacity gaps (where supply is too low to meet demand) and utilization gaps (where supply exists but is underused) — across age groups and over time. Both modules analyze results by race, income, geography, and community characteristics. Both modules can layer in community indices like the Child Opportunity Index (COI) and Social Vulnerability Index (SVI) — so agencies can distinguish shortfalls in high-vulnerability communities from those in more advantaged areas.
State agencies use these insights to pinpoint where underserved populations are concentrated, support child care grant applications with evidence, and build a data-backed case for targeted investment in high-need communities.
CUSP Foundation is a complete early childhood data and analytics solution: an integrated data model and a set of ready-to-use analytical products that turn integrated data into insight state agencies can act on from day one. CUSP Advanced goes a step further, building on that foundation with workflow-embedded operational modules that help program staff do their daily work across functions like child care subsidy, licensing, risk management, financial auditing, and regulatory compliance. Most agencies begin with Foundation to establish coordinated early childhood data and unlock the analytical products that come with it, and then adopt Advanced modules when their operational teams need integrated tools to run those functions. The two work together as part of a scalable, long-term data and operations strategy.
Yes. One of CUSP Foundation's defining capabilities is that it serves as an early childhood data platform that models the entire child population, not just children currently enrolled in programs. By integrating population-level data alongside program enrollment records, the platform makes child care data hidden gaps and unmet need visible at both the state and local level. This early childhood platform unmet need identification capability is critical for agencies seeking to understand the true scope of demand, identify communities where families are going without services, and communicate the full picture of need to funders, legislators, and policymakers.