
CUSP Foundation
Extend Your Insights: Population, Supply, and Gap Analytics
Built on the Standard Modules, CUSP Foundation includes modules that transform integrated data into targeted insights for planning, service design, and access analysis — covering the child population your state serves, the supply needed to serve them, and the gaps between the two.
Provider Analytics
Track how your state's child care provider network is changing, where capacity exists, and where the system needs attention — updated monthly, broken down by provider type, and built on CUSP Core.
What Provider Analytics Helps You Understand
Provider Analytics helps you understand the dynamics of your child care provider network.
Who makes up our provider network and how is it changing?
Understand the composition of your provider network, including provider types, program participation, quality ratings, geographic distribution, and licensed capacity. Track how the network is changing over time.
How stable is our provider network?
Understand where the provider network is growing or contracting, and where turnover may affect long-term availability of services.Which providers participate in publicly funded programs?
Monitor provider participation in publicly-funded child care programs. Understand where publicly-funded capacity is growing or declining and which provider types are driving change.How Agencies Use It
Four ways state teams put Provider Analytics to work.
Catch supply disruptions early
Provider Analytics tracks monthly trends, acting as an early warning system for your provider network, so your team can respond before families lose access to care.
Strengthen provider participation in subsidy programs
Monitor provider participation in subsidy programs to understand trends, respond to declining participation, and expand access to publicly-funded care.Plan and allocate with confidence
Use capacity and trend data by provider type and region to inform resource allocation, grant targeting, and infrastructure investment — with historical comparisons to back up every recommendation.Strengthen your provider network
Provider Analytics helps your team identify and respond to risks and opportunities — and make informed decisions about where to focus resources. Ready to learn more about your provider network?
Gap Analytics
Understand who is being served, who is not, and why gaps persist. Child Care Gap Analytics helps states examine unmet need from multiple angles. Built on Core, Gap Analytics enables agencies to analyze gaps across child age groups, geographies, demographic dimensions, and over time. Gap Analytics helps agencies understand patterns of unmet need across populations, complementing Access Desert Analytics geographically precise view of where licensed child care supply falls short of community need.
What Gap Analytics Helps You Understand
Gap Analytics helps state agencies answer key questions about who is not being served and why.
Where does capacity fall short — and where does it go unused?
Distinguish between communities where service gaps are driven by insufficient supply and those where capacity exists but is not fully utilized. Understanding the difference changes the response: a capacity shortfall calls for new supply, while an underutilization gap may call for outreach, transportation support, or changes in program design.
Which children and families are underserved?
Compare service participation against the broader child population to identify groups that are less likely to access services. Analyze gaps by race and ethnicity, by languages spoken in the community, and by program type—so agencies can see not just where gaps exist, but who is most affected.How do gaps vary?
Layer in community characteristics—including socio-economic indicators, rural and urban classification, and indices of social vulnerability and child opportunity—to distinguish shortfalls in high-need communities from those in more advantaged areas. Users can select which indicators to apply, filter by thresholds, and adjust the combination to fit their policy context.How Agencies Use It
Three ways state teams put Gap Analytics to work.
Target interventions and investments where they matter most
Prioritize funding, capacity expansion, outreach, and other interventions where they can have the greatest impact.
Inform policy and stakeholder discussions
- Provide policymakers, agency leaders, and community partners with a clear, data-backed picture of who is being served and where gaps remain.
Monitor progress toward equity goals
Measure changes in disparities over time and assess whether agency initiatives are reducing disparities in access and participation across the populations and communities that need it most.See Where Opportunity Gaps Exist
Gap Analytics gives your team the visibility to identify disparities, prioritize action, and make more informed decisions about where to invest resources. Ready to see service gaps through a new lens?
Access Desert Analytics
Understand where child care is available, where it is not, and how severe local shortages have become. Access Desert Analytics helps states identify communities where families have limited or no realistic access to child care services. Built on Core, it enables agencies to measure, map, and monitor child care access across the state over time—at multiple geographic levels and by age group. Access Desert Analytics provides a geographically precise view of where child care supply falls short of community need, complementing Gap Analytics' ability to reveal patterns of unmet need across populations and places.
What Access Desert Analytics Helps You Understand
Access Desert Analytics helps state agencies answer key questions about the geographic availability of child care services.
Where are child care access deserts — and how severe are they?
Map communities where child care supply falls short of local need. Access Desert Analytics measures severity along a continuum, from moderate constraints to communities with no licensed child care programs.
Where do child care shortages overlap with broader community challenges?
Access Desert Analytics overlays community-level context measures—including indices of social vulnerability, child opportunity, and other socio-economic indicators. By combining these data layers, agencies can identify where child care shortages intersect with broader structural constraints.How does access vary across the state?
Compare access conditions across urban, suburban, and rural communities. Identify geographic patterns in service availability and understand how access differs from one region to another.How do access conditions differ by age group?
Infant care, toddler care, and preschool care are distinct markets with different supply dynamics. Access Desert Analytics estimates deserts by age group, revealing that a community with adequate preschool capacity may be a severe infant care desert.What is the impact of provider churn on access?
Every month, providers open, close, or expand or reduce capacity. Access Desert Analytics captures the month-to-month effects of these changes on community access to childcare. See which access deserts gained or lost capacity, which communities newly qualify as access deserts, and which no longer meet the criteria.Where would additional capacity have the greatest impact?
Identify communities where expanding child care capacity could improve access for the greatest number of children and families. Access Desert Analytics helps agencies prioritize investments based on the severity of local shortages, the age groups most affected, and community-level indicators that reveal where social, economic, and other structural barriers are most significant.How Agencies Use It
Three ways state teams put Access Desert Analytics to work.
Identify and prioritize access deserts
Pinpoint communities where child care capacity is insufficient to meet local need, disaggregated by age group and geography—at the Zip Code Tabulation Area (ZCTA), town, county, legislative district, or other level that matches how your state makes decisions.
Support capacity planning
- Use geographic analyses of supply and demand, filtered by age group, rural status, and subsidy eligibility, to prioritize capacity planning and investments to increase service availability.
Monitor access trends
Track how access conditions are changing across the state with monthly refreshes—including which communities are becoming new access deserts, which are improving, and how provider entries and exits are reshaping the access landscape month over month.Comprehensive Supply Intelligence
Multi-dimensional analysis for informed decision-making.

Stage 1: Entry
Licensing Compliance Teams
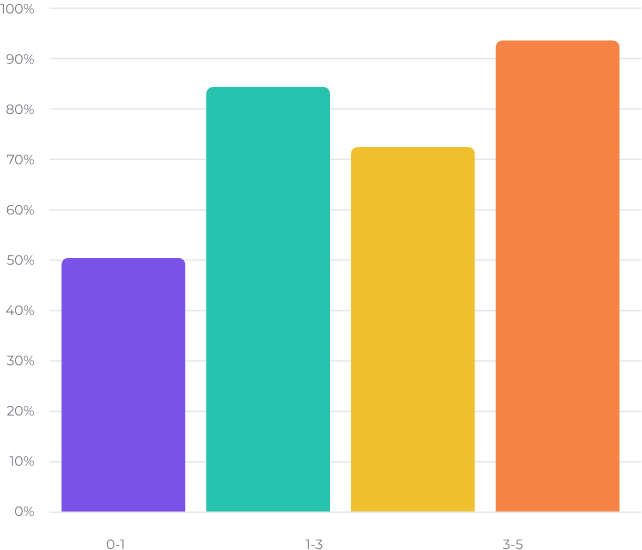
Monitor renewals and provider activity in real time. CUSP tracks new applications through to licensure, giving your team a complete view of pipeline capacity and child care provider geographic distribution of new entrants entering the market.
-
Applications submitted
-
Licenses issued by month
-
Time from application to opening
-
New capacity added to system
-
Geographic distribution of new providers
Stage 2: Active Operation
Capacity Utilization
Understand how efficiently capacity is being used with detailed child care provider enrollment position analytics. This stage of the child care supply intelligence dashboard (state-level) captures utilization patterns that reveal which providers are underserving their licensed capacity and which are consistently full.
-
Overall utilization percentage
-
Utilization by provider type
-
Utilization by age group
-
Underutilized vs. full providers
-
Seasonal utilization patterns

Stage 3: Performance Tracking
Time-Based Trends
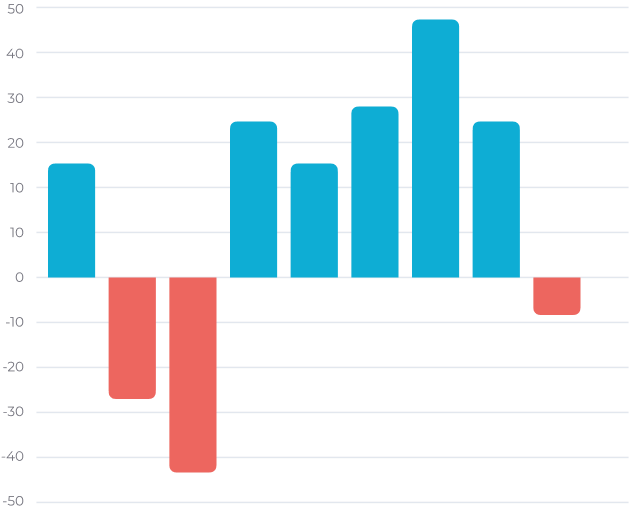
Analyze supply changes over various time periods using our predictive child care supply analytics and child care program stability analytics capabilities. Multi-year trend lines and leading indicator tracking allow agencies to model future supply needs and prepare proactively- including tracking child care supply elasticity analytics to understand how the network responds to policy and funding changes.
-
Month-over-month changes
-
Year-over-year comparisons
-
Multi-year trend lines
-
Seasonal adjustment factors
-
Leading indicator tracking
Stage 4: Exit
Provider Exits & Closures
Monitor and analyze provider departures. This stage of the platform functions as a dedicated child care sudden closure detection tool, distinguishing between voluntary closures, involuntary license revocations, and temporary suspensions to help agencies understand the true drivers of capacity loss.
-
Voluntary closures
-
Involuntary license revocations
-
Temporary vs. permanent closures
-
Capacity lost to system
-
Closure reasons and patterns
Pinpoint where child care capacity is needed most
Access Desert Analytics helps you identify where child care shortages exist, how severe they are, and where additional capacity could make the greatest difference. Ready to learn where child care capacity falls short of community need?
Child Care Fact Sheet
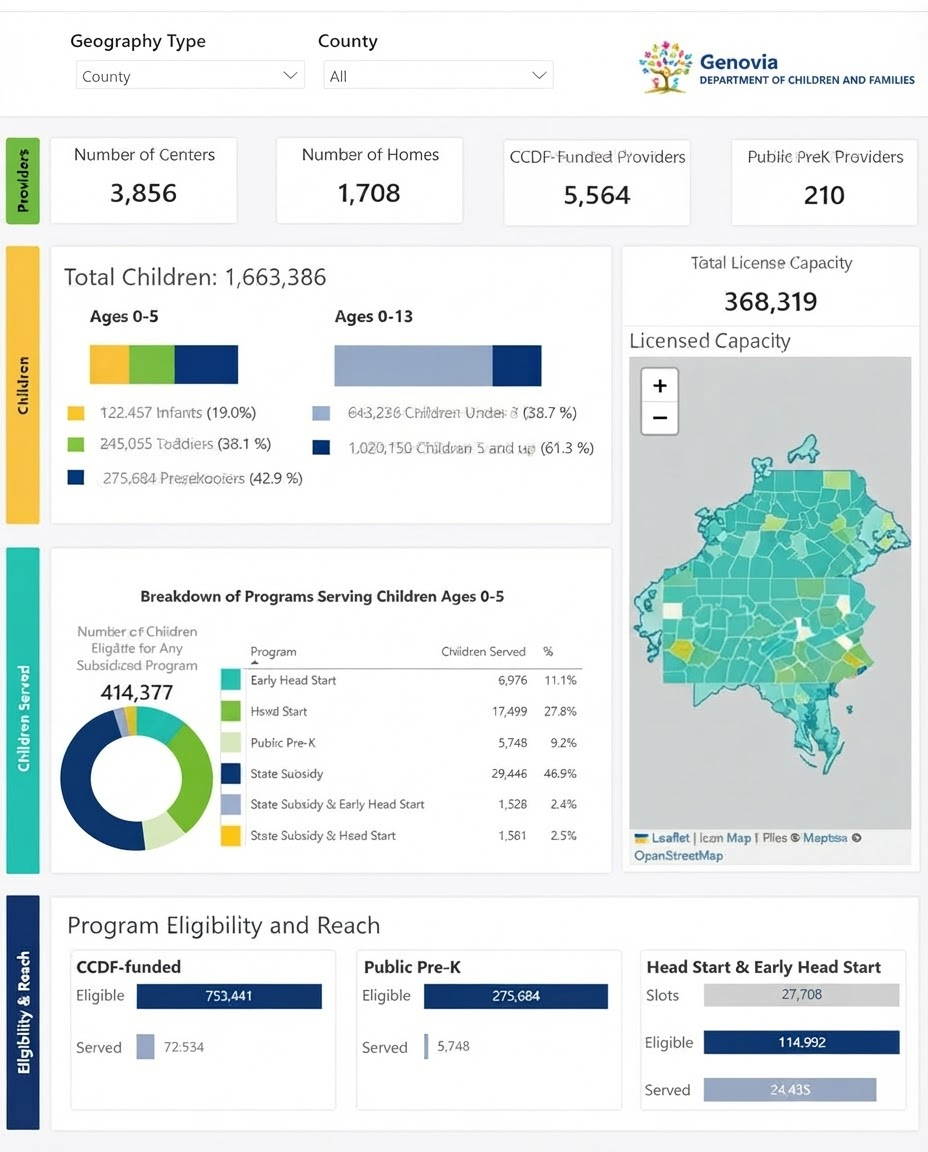
Instead of spending hours gathering and formatting data, your team can quickly create professional reports that give policymakers, funders, and community leaders the information they need to make informed decisions. Built on Core, CUSP's integrated data model, every Fact Sheet delivers a consistent, credible picture of who needs care, what resources are available, and where gaps remain.
Designed to Inform and Engage
The Child Care Fact Sheet relies on trusted data from CUSP Core. Whether you're presenting to a legislature, preparing a grant application, or building community support, you can communicate confidently using trusted, up-to-date data.
Built for Busy Decision-Makers
Communicate complex information in an easy-to-read and digest format.-
Clear, concise one-page summaries
-
Designed for legislators, funders, and community leaders
-
Focused on needs, gaps, and opportunities to take action
Ready When You Need It
Create polished, accurate reports in seconds-
Auto-populated with data refreshed monthly from Core
-
Configurable by geography, audience, and metrics
-
Available for any community or site your state defines
Powered by Trusted Data
Every Fact Sheet is built from Core, 3Si's integrated data model.-
Verified data sources
-
Consistent methodology
-
Transparent, defensible reporting
Share Anywhere
Delivered in the format your audience prefers.-
PDF export
-
Print-ready reports
-
Shareable web links for social media
Common Uses
Organizations use Child Care Fact Sheets to:
Why It Matters
Every Fact Sheet is generated from Core, 3Si's integrated data model, so the numbers your team shares externally are consistent with the numbers your analysts use internally. No more reconciling spreadsheets against dashboards, or explaining why two reports show different figures. One data source, one story, one set of facts your partners can trust.
Make the Case for Every Child
Transform your data into compelling stories that inspire lawmakers, funders, and community leaders to invest in the future of children and families.